Analytics
Traffic & analytics dashboard
Self-serve insights · 4 analytics tools consolidated
The challenge
The growth and product teams were paying for Mixpanel, Amplitude, a self-hosted Redash setup, and a Google Data Studio connector — four tools with partially overlapping data and no agreed-upon source of truth. Answering a simple question like 'what's our top-of-funnel this week vs last week?' required opening three tabs and manually reconciling different attribution models.
What we built
We built a consolidated internal analytics dashboard pulling traffic, event, and funnel data from their existing tracking layer into a single UI. Tab-based views for Traffic, Pages, Sources, and Events give each team their own starting point without duplicating data. The growth team now runs weekly experiment analyses directly from the dashboard without any SQL.
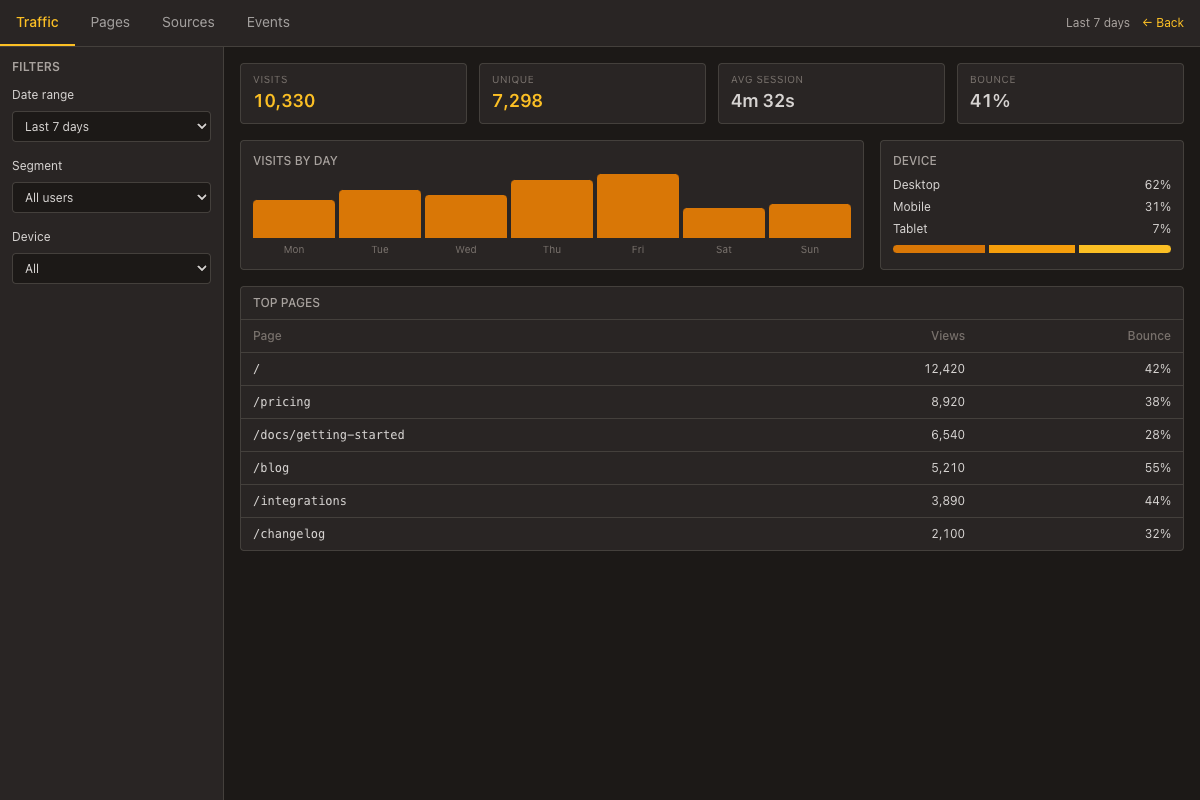
- Day-by-day visit trends with bounce rate and avg session time
- Top pages table with views and bounce metrics
- Device breakdown: Desktop, Mobile, Tablet
- Tab-based views: Traffic, Pages, Sources, Events
Results
- 4 third-party analytics tools consolidated into one internal dashboard
- $1,400/month in redundant SaaS tool costs eliminated
- Growth team ships experiment analyses 2× faster without tool-switching
- Single agreed-upon attribution model across product and marketing